Is 2026 the Start of Copper’s True Supercycle?
The Perfect Storm
A “Supercycle” is defined as a prolonged period—often decades—where commodity prices trend well above their long-term average due to a structural shift in demand that supply cannot match in the medium term. The last one was China’s industrialization from 2000-2011, which lifted copper from $1,800/tonne to over $10,000/tonne. The 2026 supercycle is bigger, broader, and more durable.
This time, the demand shock is not coming from a single country. It is coming from three simultaneous global transformations: artificial intelligence and data-center proliferation, the legally mandated green energy transition, and decades of chronic underinvestment in mine supply. Each pillar would be bullish on its own. Together, they create a demand matrix that the mining industry is structurally incapable of satisfying before the early 2030s.
Defining the Supercycle: Lessons from History
To understand why 2026 matters, we must examine previous supercycles and what made them tick.
The U.S. Industrialization (1870-1913)
America’s post-Civil War expansion electrified cities, built transcontinental railroads, and mechanized manufacturing. Copper prices rose steadily for four decades, interrupted only by short recessions. The key characteristic was duration: supercycles are not bull markets; they are secular trends that outlast business cycles.
Post-WWII Reconstruction (1945-1970)
The rebuilding of Europe and Japan, combined with the suburbanization of America, created a copper demand wave that lasted 25 years. Prices rose from $300/tonne to over $1,400/tonne. Mining stocks outperformed broad equity indices by a factor of three.
The China Boom (2000-2011)
China’s entry into the World Trade Organization triggered the largest infrastructure build-out in human history. Cities the size of London were constructed annually. Copper demand doubled in a decade. Prices peaked near $10,000/tonne in 2011. Mining equities delivered 10x returns. The defining feature was the speed of demand acceleration—supply simply could not keep up.
Why This Cycle Is Different
The 2026 supercycle differs from its predecessors in three critical dimensions:
Duration: Previous supercycles were demand-led and faded when the underlying industrialization slowed. This cycle is driven by legally mandated transitions (net-zero targets) and technological shifts (AI, EVs) that have multi-decade timelines. The European Union has banned new ICE vehicle sales from 2035. The U.S. Inflation Reduction Act extends tax credits through 2032. These are not cyclical policies; they are structural laws.
Drivers: China’s boom was primarily construction and export manufacturing. Today’s demand is electrification, digitalization, and decarbonization. These are more copper-intensive per unit of GDP than construction because they involve power generation, transmission, and storage at every stage.
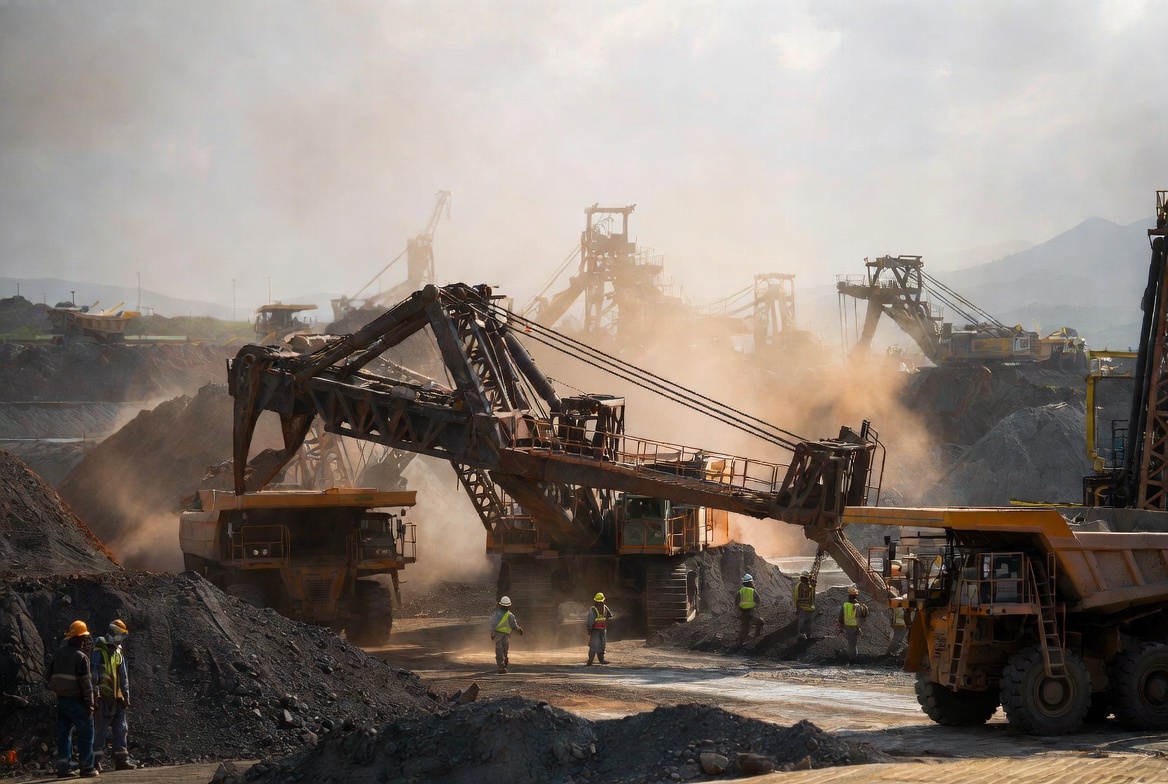
Supply Constraints: Previous supercycles eventually incentivized new supply. This time, the supply response is broken. Social license to operate has collapsed, ore grades are in terminal decline, and the project pipeline is the thinnest in 30 years. For details on why new mines cannot be built fast enough, see our report on the copper supply crisis through 2030.
The Three Pillars of the Bull Case: A Data-Driven Analysis
Pillar 1: AI and Data Centers
A ChatGPT query uses approximately ten times the energy of a standard Google search. That energy must be generated, transmitted, and dissipated—and all three stages require copper. Data centers are upgrading power infrastructure from 10 MW to 100 MW+ per campus. They need copper busbars for power distribution, copper tubing for liquid cooling loops, and massive copper-laden transmission lines to connect to the grid.
By 2028, AI-focused data centers alone could consume 500,000-700,000 tonnes of copper annually. That is equivalent to adding a new Chile-sized demand segment within five years. This is “new” demand that did not exist in previous commodity cycles. Unlike cloud computing, which consolidated into efficient hyperscale facilities, AI training requires distributed, power-hungry GPU clusters that strain local grids.
Pillar 2: The Green Transition (Net Zero)
Solar and wind are physically metal-intensive. A coal-fired power plant requires approximately 1 tonne of copper per megawatt of capacity. An offshore wind farm requires 8-10 tonnes per megawatt. Solar photovoltaic installations require 3-5 tonnes per megawatt. The renewable transition is not just replacing fossil fuel capacity; it is overbuilding to compensate for intermittency, which means more transmission lines, more transformers, and more storage.
EVs use 3-4 times more copper than internal combustion engine vehicles. With global EV penetration projected to reach 45% by 2030, the transport sector alone will add 2-3 million tonnes of incremental annual copper demand. This is not a consumer preference; in the EU, it is law. The regulatory floor under EV demand means copper intensity in transport is non-negotiable.
Pillar 3: Chronic Underinvestment
Miners spent the last decade pleasing shareholders with dividends and buybacks instead of exploring for new deposits. Exploration budgets were slashed after the 2011-2015 bear market, and they never recovered. Discoveries of large-scale copper deposits have collapsed. The average grade of ore processed globally has fallen by 40% over the past two decades, meaning miners must move more rock to produce the same metal.
It takes approximately 16 years to open a new mine from discovery to first production. Even if exploration budgets tripled today—which they have not—the first new supply would not arrive before 2040. Supply cannot react fast enough. The pipeline of projects approved before 2025 will barely offset depletion at existing mines, let alone satisfy demand growth.
Geopolitical risk compounds the supply problem. Chile’s Codelco, the world’s largest copper producer, is struggling with falling grades, water shortages, and operational inefficiencies. Our Codelco crisis analysis details why state-owned production is in structural decline. Peru, the second-largest producer, faces relentless political unrest and community opposition to new projects; read our coverage of Peru’s mining political risk for the full picture. And while the DRC’s Kamoa-Kakula complex offers high-grade growth, logistics and governance risks remain acute, as we discuss in our Kamoa-Kakula copperbelt report.
Historical Analogies: What Happened in Previous Supercycles
When supply cannot meet structurally rising demand, prices do not just rise—they explode. In the China supercycle, copper prices appreciated over 450% from trough to peak. But the real wealth creation was in mining equities. Major producers like Freeport-McMoRan and Southern Copper delivered 15x-25x returns between 2000 and 2011. Junior explorers with viable deposits saw 50x-100x moves.
The pattern is consistent: early in a supercycle, the spot price leads. Mining equities lag because investors are skeptical. As the price rally persists, equities re-rate upward, first on earnings expansion (higher realized prices), then on multiple expansion (investors pay higher P/E ratios because they believe the cycle is durable). Late in the cycle, exploration companies with marginal assets surge as capital seeks any levered exposure.
We are currently in the early-to-middle phase. Copper prices have risen from 2020 lows, but mining equities have not re-rated to supercycle multiples. This creates an asymmetric opportunity: if the supercycle thesis is correct, equities have significant catch-up potential.
Which Assets Perform Best in Supercycles
Not all copper exposures are created equal. Historical performance suggests a hierarchy:
-
High-Quality Growth Producers: Companies with low-cost, expandable assets in stable jurisdictions. They benefit immediately from higher prices and can reinvest cash flow into expansion.
-
Royalty and Streaming Companies: They provide leverage to the copper price without operational risk. Their returns are typically 70-80% of the underlying metal’s move, with far less volatility.
-
ETFs and Index Funds: Provide diversified exposure but dilute the upside because they include marginal producers and hedged positions. For an overview of available vehicles, see our ranking of the top copper ETFs for 2026.
-
Physical Copper: Offers pure price exposure but carries storage costs, insurance, and liquidity constraints. Suitable for catastrophic hedging, not wealth maximization.
-
Junior Explorers: The highest-risk, highest-reward category. In supercycles, successful explorers can deliver 10x-50x returns. In failed cycles, they go to zero. Only appropriate for small, speculative allocations.
Risks That Could End the Supercycle Early
No thesis is without risks. The supercycle could be derailed by several factors:
Global Recession: A deep, synchronized downturn could destroy industrial demand faster than supply constraints lift prices. However, the 2008 experience showed that copper demand rebounded within 18 months because Chinese stimulus filled the gap. Today’s demand is more geographically diversified, reducing single-country dependency.
Technological Substitution: Aluminum could substitute copper in some power cables and wind turbine wiring. High-temperature superconductors could eventually reduce grid copper needs. Solid-state batteries might use less copper than lithium-ion. These risks are real but long-dated; none will materially impact demand before 2032.
Policy Reversal: A change in political leadership in the U.S. or EU could slow green-transition spending. However, once EV factories, battery plants, and wind farms are under construction, they are politically difficult to cancel. The sunk-cost dynamic protects forward demand.
New Supply Discoveries: A series of massive, high-grade discoveries could reset the supply narrative. The probability is low given exploration trends, but not zero. The deep-sea mining frontier (polymetallic nodules) is the wildcard, though regulatory and environmental hurdles remain formidable.
Timeline: When Does the Supercycle Peak?
Supercycles typically last 15-25 years. If we mark the beginning of this cycle around 2020-2022 (the COVID demand shock and green-policy inflection), the midpoint would be 2030-2035 and the peak 2035-2045. This is not a prediction of a single price spike, but a framework for thinking about duration.
Copper prices could reach $15,000/tonne by 2028-2029 as deficits bite. By the mid-2030s, if substitution and recycling have not scaled sufficiently, $20,000+ is conceivable. The path will not be linear. There will be 20-30% corrections along the way. But the secular vector is upward.
The Prediction
We expect copper to decouple from general GDP. Even if the economy slows, the essential nature of copper for strategic national security (energy independence, military electrification, grid resilience) will keep a floor under the price. Governments will stockpile. Utilities will pay any price to keep the lights on. Manufacturers will absorb pass-through costs because they have no alternative.
$15,000/tonne is not a meme; it is a supply-demand mathematical probability by 2028. The only question is whether investors position themselves before the market fully prices in the duration of this cycle. The time to build exposure is when the thesis is still debated, not when it is consensus. In 2026, we are still in the debate phase. That is the opportunity.